[Activity 7]
Image segmentation is taking a part of the image so that further image processing can be done to it. For example, if we have a grayscale image of a check, we can use image segmentation to find the parts of the check that have writing/text on it.

To properly segment the grayscale image, we need the histogram of the image.
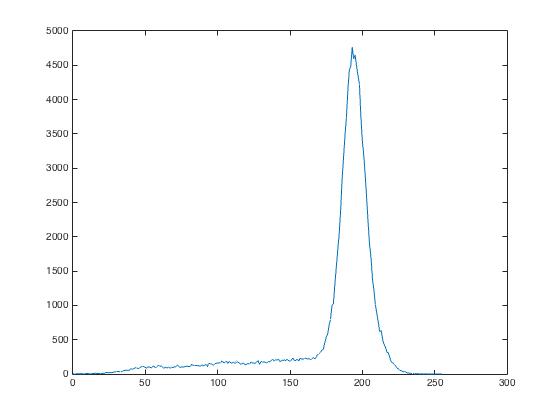
Note that the large peak corresponds to the background pixels of the check. Now it’s just a matter of segmenting the image to values lower than that peak. Depending on the threshold, the segment of the image will change.
I = imread(‘cropped_grayscale_check.jpg’);
[count, cells] = imhist(I,256);
plot(cells,count)
BW = I < 125;
imshow(BW)


See how the highlighted parts of the check changes for different thresholds. Also note how the text of the image looks the clearest for a threshold value of 125.
But what if our image is colored? Obviously this same technique won’t work that easily. To do so, it would be better if we change the RGB values of our image into two components, chromaticity and brightness. One such system is the normalized chromaticity coordinates(NCC) rgb. To convert to the NCC:
I = R + B + G = brightness
r = R/I
b = B/I
g = G/I
and r + b + g = 1
So it is enough to represent chromaticity by just the r and g values as shown by the image below:
As you can see, regardless of the brightness of a color, it will occupy the same spot or area in the normalized chromaticity space.
There are two methods to segment a colored photo, the Parametric Probability Distribution or the Non-Parametric Probability Distribution or Histogram Backprojection.
1.Parametric Probability Distribution method
The Parametric Probability Distribution method is based on the idea that each pixel has a probability that it belongs to the color distribution of interest.
First, we need to obtain a subsection of the region of interest(ROI) and get its color histogram.
By normalizing the histogram with the number of pixels, we get the probability distribution function (PDF) of the color. In order to tag a pixel as part of the ROI, we need the pixel’s probability of belonging to the color of the ROI. Since our color space is in terms of r and g, we can use the joint probability p(r)p(g) function to test the likelihood that a pixel is part of the ROI. We can assume a Gaussian distribution along r and g that is independent of each other.Hence, the probability that a pixel with chromaticity r belongs to the ROI is:

And this goes also for g. The joint probability is the product of these two probabilities.
I did this with the following image of Jake from Adventure Time:

After selecting an ROI, which was the yellow background, this is what we get:

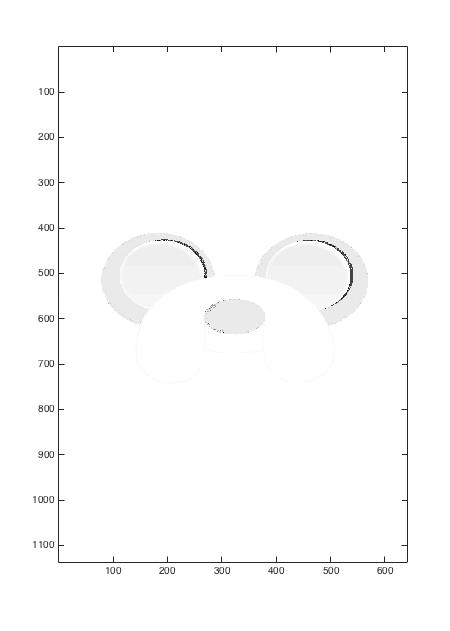
What does this mean? This means the white area is what the code thinks is part of the ROI, which in this case corresponds to the yellow color of Jake.
This segmentation can be done with other parts of Jake, such as his nose.

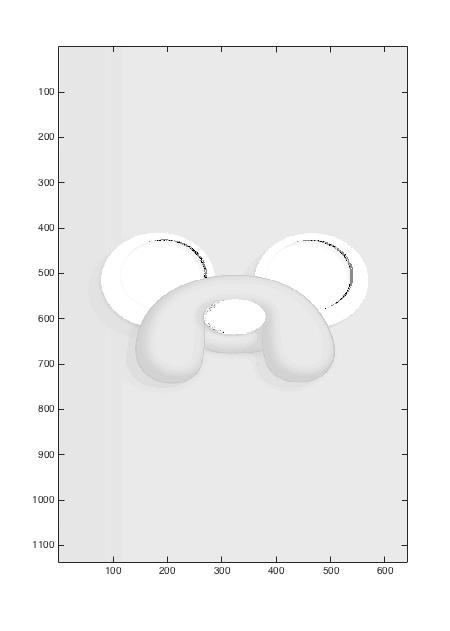
Here, if we select his nose as the ROI, notice how his nose and his eyes get highlighted. this is because in terms of the NCC, white, grey, and black have very close values, hence our code cannot differentiate the two extremes.
2.Histogram Backprojection (Non-parametric Probability Distribution)
Now this method is a bit more confusing, but in terms of programming, it is much faster to run than our previous method.
Again, we need to get the color histogram from the ROI. Representing the RGB values of each pixel as NCC (getting the rgb), each pixel from the original image is now given a value equal to its histogram value in the chromaticity space. Let’s try this method with our image of Jake. (refer to Figure 9a, 10a).
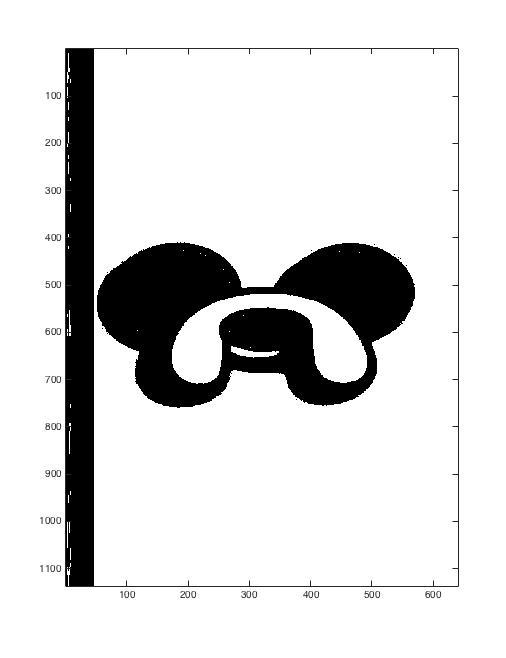
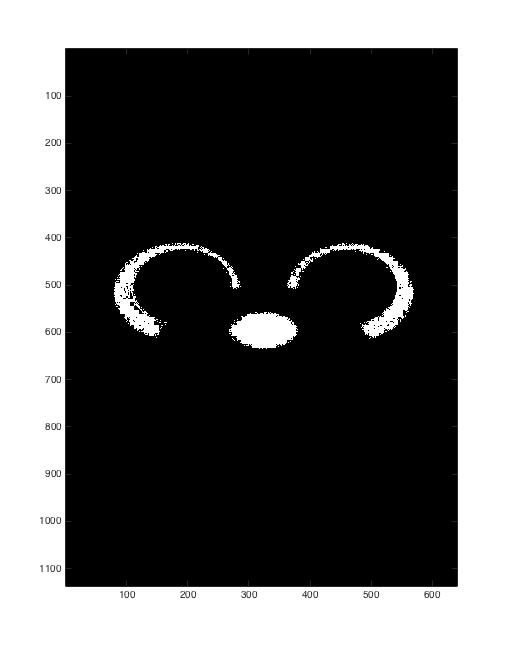
As you can see, the segmentation using histogram backprojection has much better results as compared to our first method.
Grade 10/10

